Using a Machine Learning Model to Predict the 2024-2025 Season

By Trey Elder Dec 20, 2024
For my final project, I used game-level data from the last sixteen NHL regular seasons to train a machine learning model to predict the final standings for the 2024-2025 regular season. The dataset contains information about both teams from every regular season game since the 2008-2009 season on over 100 variables. This means that each team that plays in a game is considered its own observation. For example, when the Washington Capitals played the St. Louis Blues on November 15, 2014, the two teams are listed as separate observations, with all variables being recorded for both teams individually. The variables include information on counting statistics like shots, hits, and takeaways, as well as calculated statistics like expected goals for and total shot credit. I chose to eliminate games that ended in a shootout from the dataset because the variables in the dataset only captured the events of regular gameplay, not what happened during the shootout. Thus, it would be inaccurate to say that the variables had full influence on the outcome of the game when in reality, the game was decided in the shootout, which is unmeasured by the variables in the dataset. This removed 3,888 observations, or 1,944 games, from the dataset, leaving us with 34,080 observations, or 17,040 regular season games. The dataset came from MoneyPuck.com.
The goal of my analysis was to use the data to train a logistic regression model to predict the final standings for the 2024-2025 NHL regular season. To do this, I first ran a preliminary lasso logistic regression model to assist with predictor selection. After deciding on appropriate predictors, I fit the logistic regression model and trained it using a subset of 80% of the games played between the 2008-2009 and 2023-2024 regular seasons. Lastly, I used the model to predict head-to-head win probabilities for every remaining game this season and project final standings results.
Logistic regression made sense in this context for a few reasons:
- The response variable is binary (win or loss)
- The model is more easily interpretable than naive Bayes classifiers, linear discriminant analysis, or other classification methods
- Given a test set of predictors, rather than simply classifying the predicted response variable as either a 0 or a 1 like many classification methods do, the logistic regression model predicts the probability that the response variable will be 1 (a win). If I were to use a classification method like a naive Bayes classifier, I wouldn’t be able to obtain such a value, and thus any game with a greater than 50% chance of being a win would be automatically assigned as a win. Instead, I can use the win probabilities to run a simulation in which teams are assigned wins or losses using realistic odds rather than automatically giving wins to teams that have a greater than 50% chance to win.
I wanted to try and simplify the model a bit by excluding overly complicated metrics included in the full dataset like flurryScoreVenueAdjustedxGoalsAgainst, so before conducting any analysis, I narrowed the dataset down to only 78 predictors. To further curtail the number of possible predictors for the model, I ran a lasso logistic regression on all 78 predictors. Lasso regression is a type of regularized regression that puts a penalty on the sum of the absolute values of the regression coefficients in an effort to shrink some of them towards zero. This also helps to control for multicollinearity between predictors, as the coefficients that get shrunk to zero tend to be those belonging to predictors that are highly correlated with other predictors. This is suitable for hockey datasets because hockey is a very dynamic and fluid sport, and there are lots of events that only happen as the result of other events. For example, both shotsFor and reboundsFor are listed as predictors in the dataset. A rebound can only occur if a shot is taken, therefore it is very likely that teams with more reboundsFor will also have more shotsFor, so there will be positive correlation between the two. Similarly, if a reboundFor occurs, then it is impossible for an instance of freezeFor (the opposing goaltender freezes the puck) to occur on the same shot, so it is likely these two predictors could be negatively correlated. By running a preliminary lasso regression, I am aiming to discern which variables are significantly correlated with each other so I can exclude them from the model.
The lasso logistic regression model includes 42 nonzero coefficients, down significantly from the original 78. I chose the 19 predictors for the final model based on a mixture of their variable importance as well as how relevant I believed they were in contributing to wins and losses from a theoretical perspective. A full list with descriptions of the 19 predictors can be found in the appendix section A.
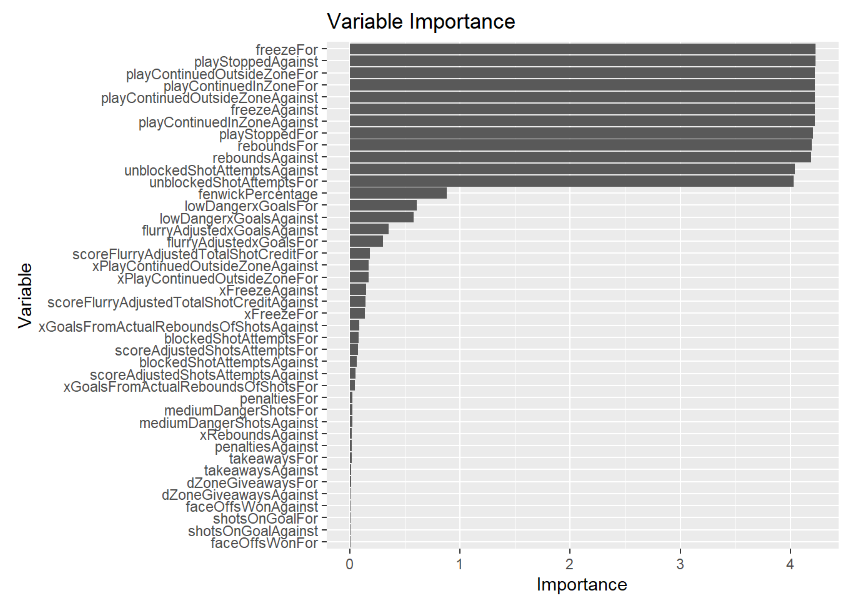
Figure 1: Variable importance plot for the preliminary lasso logistic regression on all 78 predictors
The reason why I chose, somewhat subjectively, 19 predictors for the final model instead of using all 42 predictors or simply using the 19 predictors with the highest variable importance is because I did not want to overfit the model. When I initially ran a logistic regression model that included all 42 predictors with nonzero lasso coefficients, testing the model on the training set yielded a misclassification rate of exactly zero, meaning that the model was perfectly predicting every game outcome. However, when this model was used in the simulation of the current regular season, the results were wholly unrealistic. The good teams were winning almost every single game and the bad teams were losing almost every single game. Several teams finished with over 130 points, when in reality, only three teams have ever accomplished such a feat in the 100-plus year history of the NHL. Essentially, the model was predicting results “too well”, and not accounting for the inherent randomness that is present in all human activities, including sports. When I narrowed the model down to 19 predictors, depending on the sample drawn for the training set, the misclassification rate ranged from about 22-24%. This model still predicts results relatively accurately (a little over three out of every four games), but leaves some room to account for the randomness of game outcomes.
The response value of the model can be interpreted as the win probability of Team A for a game in which their performance results in a given set of predictor values. This does not, however, take into account the performance of the opposing team, as the model only the predictor values of Team A to determine its chances of victory, making the response variable of the simple logistic model the probability that Team A wins any given game that they play, regardless of who the opponent is or how they perform. The test set is the average predictor values for each team based on the games they have played so far this season (as of December 11, 2024), so the predicted win probabilities are based solely on a team’s performance this season. In order to find the probability Team A wins a game against a specific opponent, we’ll call them Team B, we need to use a separate formula to calculate the chances each team beats the other head-to-head. This can be done using the formula in Figure 2.
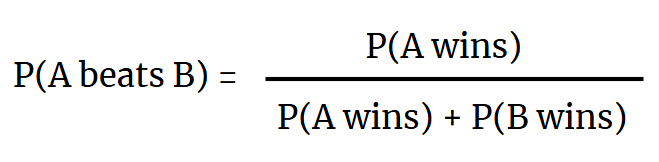
Figure 2: Formula for head-to-head win probabilities.
After finding these odds, we can generate a random number between 0 and 1 and use the odds to create decision boundaries that will determine the simulated outcome of the game. Because a team that loses in overtime or a shootout still gains one standings point from the loss (as opposed to zero points for a regulation loss or two points for a win), we need to split the decision boundaries in a way that takes into account the possibility of a game going past regulation. Approximately 23% of all NHL regular season games go to overtime, so we first divide our range into 77% regulation finishes and 23% overtime or shootout finishes. Within these two sections, each team has a subsection in which if the random number lies, the team “wins” the game. These subsections are proportional to the two teams’ head-to-head win probabilities as predicted by the model.
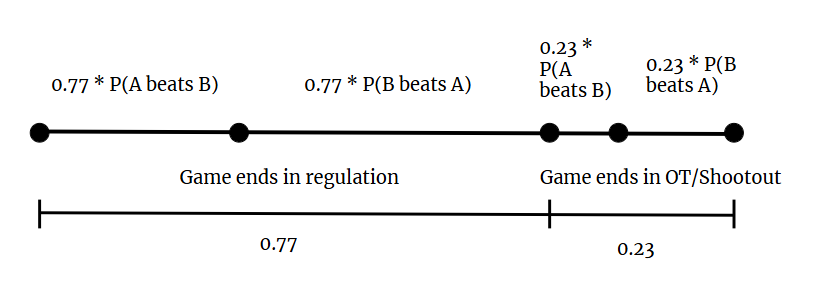
Figure 3: Decision boundaries for simulating game outcomes
By repeating this procedure for every remaining game on the schedule, we can use the model to project the final standings for the 2024-2025 regular season. In order to account for variability in both the training set selected for the model as well as the random number generator, I ran the simulation 100 times and used the average of each team’s season-end point total for their placement in the standings. This ensures the point totals for each team will be close to their true expected value.
Projected 2024-2025 Regular Season Standings
Using data from games up to December 19
| Atlantic Division | Metropolitain Division | Central Division | Pacific Division | ||||
|---|---|---|---|---|---|---|---|
| Tampa Bay Lightning | 104 | Washington Capitals | 110 | Winnipeg Jets | 106 | Vegas Golden Knights | 106 |
| Toronto Maple Leafs | 103 | New Jersey Devils | 107 | Minnesota Wild | 105 | Los Angeles Kings | 100 |
| Boston Bruins | 93 | Carolina Hurricanes | 96 | Dallas Stars | 93 | Edmonton Oilers | 95 |
| Florida Panthers | 92 | Philadelphia Flyers | 90 | Colorado Avalanche | 93 | Vancouver Canucks | 95 |
| Ottawa Senators | 91 | New York Rangers | 88 | Utah Hockey Club | 88 | Calgary Flames | 88 |
| Detroit Red Wings | 89 | New York Islanders | 84 | St. Louis Blues | 86 | Seattle Kraken | 87 |
| Montreal Canadiens | 82 | Pittsburgh Penguins | 82 | Chicago Blackhawks | 81 | Anaheim Ducks | 82 |
| Buffalo Sabres | 74 | Columbus Blue Jackets | 78 | Nashville Predators | 72 | San Jose Sharks | 78 |
The model has the Capitals continuing their hot start and capturing their fourth Presidents' Trophy in franchise history, followed by the New Jersey Devils, Winnipeg Jets, Vegas Golden Knights and Minnesota Wild to round out the top five, while the Blackhawks, Blue Jackets, Sharks, Sabres and Predators see themselves finishing at the bottom.
Appendix - List of Model Predictors
- mediumDangerShotsFor - Number of unblocked shot attempts for a team that have between an 8 and 20% chance of resulting in a goal
- highDangerShotsFor - Number of unblocked shot attempts for a team that have greater than a 20% chance of resulting in a goal
- fenwickPercentage - Percentage of all unblocked shot attempts that belong to a team
- unblockedShotAttemptsFor - Number of unblocked shots attempts for a team
- unblockedShotAttemptsAgainst - Number of shot unblocked shots attempts against a team (by the other team)
- reboundsFor - Number of shots by a team that resulted in a rebound
- reboundsAgainst - Number of shots by the other team that resulted in a rebound
- freezeFor - Number of times the opposing goaltender freezes the puck after a team’s shot (stopping play)
- freezeAgainst - Number of times a team’s goaltender freezes the puck after the opposing team’s shot
- playStoppedFor - Number of times the play is stopped after shots by a team for reasons other than the goalie freezing the puck, such as the puck going over the glass or a dislodged net
- playStoppedAgainst - Number of times the play is stopped after shots from the opposing team for reasons other than the goalie freezing the puck, such as the puck going over the glass or a dislodged net
- takeawaysFor - Number of times a player on a team takes the puck away from a player on the other team
- takeawaysAgainst - Number of times a player on the opposing team takes the puck away from a player on the team
- flurryAdjustedxGoalsFor - Number of expected goals for a team, adjusting for scoring chances that result in a flurry of shots
- flurryAdjustedxGoalsAgainst - Number of expected goals for the opposing team, adjusting for scoring chances that result in a flurry of shots
- lowDangerxGoalsFor - Number of expected goals for a team from shots that have less than an 8% chance of resulting in a goal
- lowDangerxGoalsAgainst - Number of expected goals for the opposing team from shots that have less than an 8% chance of resulting in a goal
- blockedShotAttemptsFor - Number of shot attempts for a team that get blocked by the opposing team
- blockedShotAttemptsAgainst - Number of shot attempts for the opposing team that get blocked by a team