Data Analysis Methods.
Files with the code I used for some of the articles can be found at My Github Page
An Analysis of Offensive Zone Hits
I used Dan Morse's "hockeyR" R package to acquire a dataset containing play-by-play data for every regular season and postseason NHL game from 2010 to 2023. I used R programming, mainly the "tidyverse" and "dyplr" packages, to manipulate the data to be able to identify hits that led to shots on goal and determine in which region of the offensive zone they occurred.
The Blackhawks' Stanley Cup Marathon
I used Microsoft Excel and R programming to filter and analyze a dataset consisting of over 150 variables for the 1121 players who participated in the playoffs from 2009 to 2024. I used Tableau to create the bar chart.
Using Clustering Analysis to Categorize NHL Defensemen
I used k-means clustering to classify NHL defensemen into eight categories. The dataset I used came from MoneyPuck and included over 100 variables of season-level data for each player, 16 of which I used in the clustering algorithm. I also conducted principal component analysis on the sixteen variables to help determine which variables contributed most to the clusters. For the coding aspect of this project I worked in RStudio. I used Tableau to create the scatterplots in this article.

Using a Machine Learning Model to Predict the 2024-2025 Regular Season
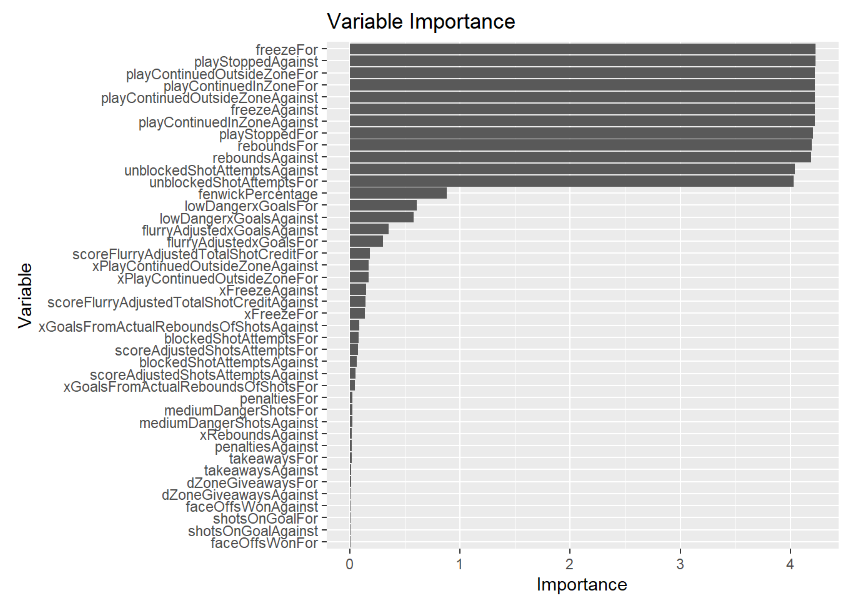
This semester I took a machine learning class and for my research project created a logistic regression model using R to predict game results for the 2024-2025 NHL regular season. After using a lasso regression model to choose 19 predictors, I trained the logistic model using game-level data for every team from the past 16 regular seasons, with the response variable being whether or not the team won the game. Using average predictor values for each team from the games they have played so far this season, I was able to calculate win probabilities for every remaining game and run a simulation to generate end-of-season standings predictions. Below is the variable importance plot for the lasso regression.
We Have Reached Peak Carolina. Now What?
For my analysis I used a dataset that included game-level data for every season since 2008-2009. I worked in RStudio using the tidyverse package to manipulate the data and calculate all the 5 on 5 statistics for Carolina. For the visualizations, I used Tableau to create a series of scatterplots to compare Carolina’s finishing ability to that of the rest of the league, with which I was able to see how bad their finishing has been in recent years.

Chris Kreider Is the Best Net-Front Presence in the NHL
The dataset I used for my analysis included every shot taken since the 2007-2008 season. This includes 1,839,233 total shots, regular season and postseason. Working with the R programming language in RStudio, I used the "tidyverse" package to combine the 17 seasons of data into a single dataframe. I used this dataframe to aggregate the data and calculate various statistics over the last six NHL seasons as well as at a season-by-season numbers, including tip-in goals, shots and attempts, rebound goals, shots and attempts, and average proximity of goals. I also created a visualization with Tableau that uses shot location data to map the exact spot on the ice that Chris Kreider scored his power play goals from in each of the last six seasons.

"That's Not Hockey": On Shootouts and Penalty Shots
For this article I created my own dataset by combining records of penalty shots and shootouts since the start of the 2005-2006 season from Hockey Reference and the NHL’s official website. I then worked in RStudio using the "tidyverse" package to aggregate the data and calculate winning percentages for teams that receive penalty shots and individual shootout percentages, among other statistics. I created the two bar graphs in the article using Tableau.
The Blackhawks' Hidden Gem
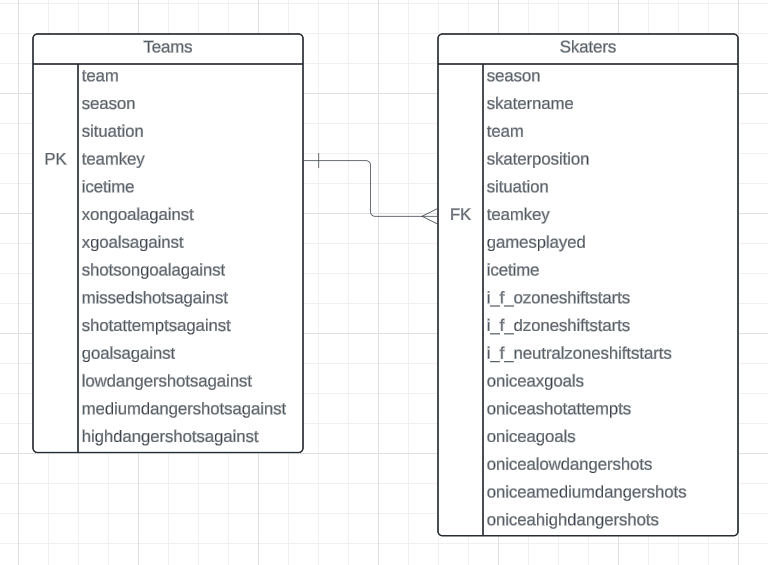
I used SQL queries to conduct my analysis via PostgreSQL and pgAdmin. I created my own database in pgAdmin by joining the “Skaters” and “Team Level” data tables for the 2023-2024 season from MoneyPuck. I had to join the tables using a composite key that I created as initially, there was no foreign key. Below is the entity relationship diagram for the database.
The proprietary statistic I came up with to measure a defender's relative contributions to his team’s defense was goals below team per 60 minutes, or GBT60. The formula below calculates this metric when icetime is measured in seconds.

An Attempt to Determine the Best Goaltending Series in Recent History
The dataset I used for my analysis included every shot taken since the 2007-2008 season. This includes 1,839,233 total shots, regular season and postseason. Working with the R programming language in RStudio, I used the "tidyverse" package to combine the 17 seasons of data into a single dataframe and calculate save percentage, expected goals per shot on goal, expected goals per goal, and save percentage above expected, and average shot distance per goal.